
Analyzing how differing percolation test protocols affect the design of absorption systems
The previous article in this two-part series introduced on-site wastewater absorption systems and discussed the importance of understanding soil properties to properly select the long term application rate (LTAR) for designing such systems. Two methods are currently used to make this determination, the percolation test and soil classification. Both methods are part of a comprehensive site assessment that examines other factors that influence the success of an absorption system.
The percolation test (perc test) has traditionally been the primary tool used to determine the LTAR for wastewater disposal. The perc test was developed in the USA in the 1920s and has been adopted by many organizations. No standard test method exists, so a number of different testing protocols are in use. The LTAR is determined using an empirical relationship between perc test results and LTAR, originally published by the US Environmental Protection Agency (USEPA) in 1980.
The second method to determine the LTAR is through the use of soil characteristics. Many regulatory bodies, including the USEPA since 2002, use the texture and structure of subsurface soil to determine the LTAR rather than the perc test. Accurately determining soil characteristics requires considerable training and experience and the classifier needs access to the undisturbed soil column under the proposed wastewater disposal system, which often requires excavation of a test pit 2-3 meters deep.
EMI’s Evaluation of Percolation Test Procedures
The perc test is relatively simple and requires a hand auger, water supply, and water depth measurement device. However, the lack of a consistent standard test method makes the results uncertain.
The soil classification method may be more accurate in some soils, though its accuracy in tropical soils is uncertain. Accurate soil classification is difficult, especially considering EMI trips rarely have a soil scientist on the project team and excavating a large test pit is difficult. Therefore, the perc test appears to be the most appropriate method for most EMI trips. To improve the reliability of this test, the EMI Uganda office undertook a study of the test protocol itself.
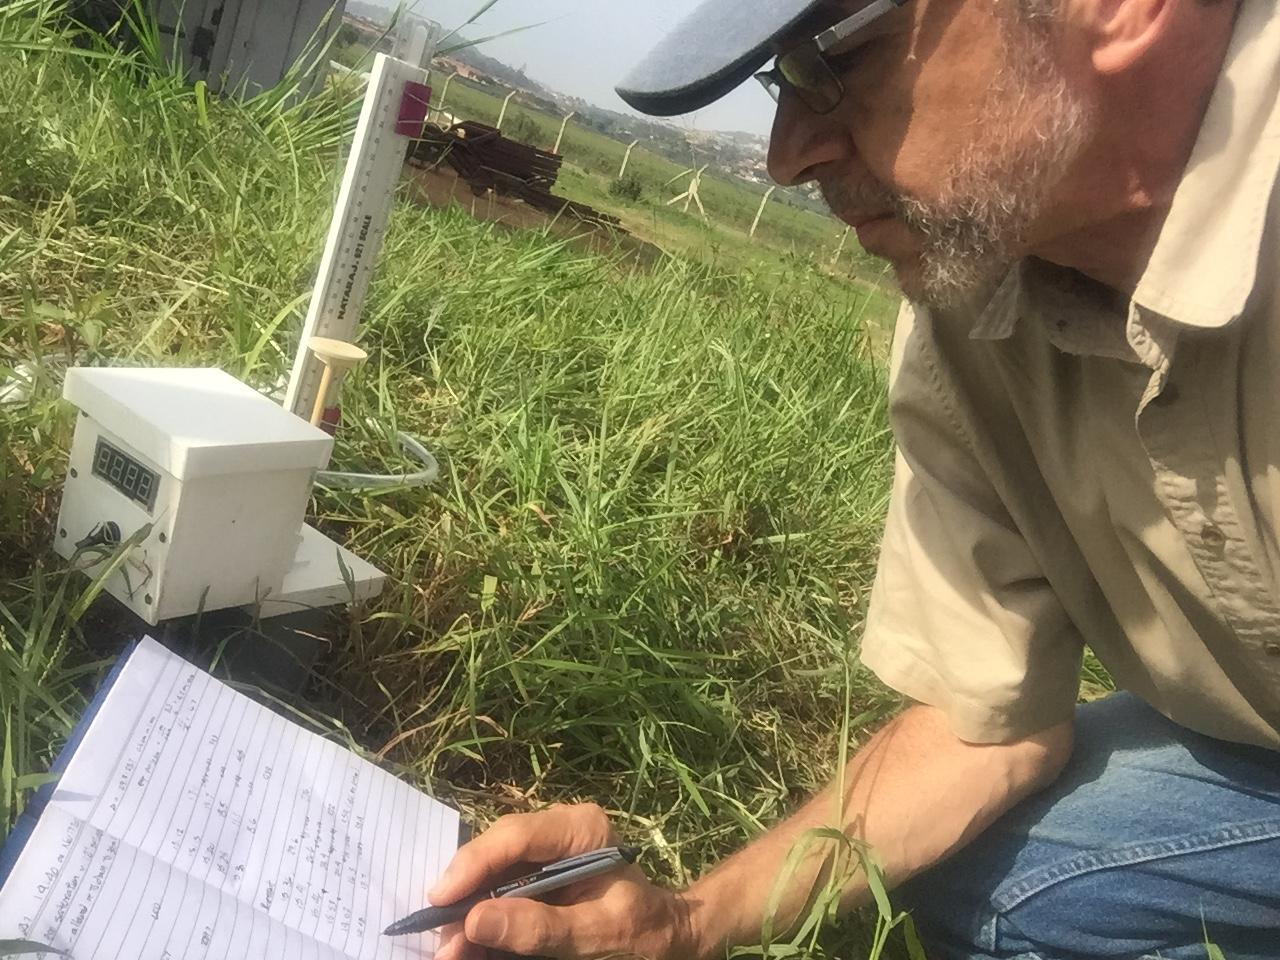
In this study, EMI investigated the effects of changing different test protocol elements. The elements studied include the test hole size and shape, how the hole is prepared for the test, how long the hole is saturated prior to the test, and the depth of water in the test hole. This study involved completing many high-precision perc tests, varying one test parameter at a time to assess the effects on the perc test value and resulting LTAR determination.
To begin, EMI performed the original perc test procedure published by the USEPA in 1980 (called the baseline protocol) and used the results as the control against which other results were compared. Since the empirical LTAR/perc test relationship was developed using the baseline protocol, following this protocol should yield the most accurate results, at least for soil types similar to those used to develop the relationship. The baseline protocol consists of the steps shown in Exhibit A.
Exhibit A – Baseline Perc Test Protocol
- Dig or drill a 150mm dia. hole to the intended depth of the absorption system (usually 1-2m deep, 3-5m for seepage pits).
- Scrape the inside surface of the hole with a sharp implement to remove any smearing or plugging of the surface caused by the digging process.
- Place a 50mm thick fine gravel layer in the bottom of the hole.
- Fill the hole to 300mm above the top of the gravel layer with clean water and keep the water level at this depth for at least 4 hours, 24 hours if swelling clay is present. If the hole drains two times within 10 min, no further saturation is needed.
- Refill the hole to 150mm and measure the distance from a fixed reference point to the water surface multiple times over a sufficiently long interval between measurements (1-30 min between measurements) to accurately measure the rate of water surfaced drop. Continue making measurements until the rate stabilizes (at least two consecutive tests where the water level drop does not vary by more than 2mm for the same time interval). When the water depth drops to less than 50mm, stop the test.
- Refill the test hole to 150mm above the gravel and repeat the test at least two more times for greater accuracy.
- Calculate the percolation value (in units of min/25mm) as the time in minutes for the water surface to drop 1” (25mm) after the rate has stabilized. Only the last few measurements should be used to calculate the perc value.
This study also allowed us to analyze the variation of perc test results caused by natural variation in soil composition, and how quickly the test results stabilize. We also examined the difference in LTAR values based on the perc test results and those based on soil characteristics as determined by standard field and laboratory soil analysis.
The test protocol elements studied included the following:
Soil Saturation Time |
|
0 min to 72 hours saturation before test (control - 4 hours) |
Test Hole Preparation |
|
Inner surface not cleaned (control – inner surface cleaned) |
|
Inner surface smeared with hard implement (control – smearing removed) |
|
Hole filled quickly while agitating water (control – hole filled slowly, no agitation) |
|
Gravel not added (control – 50cm gravel added) |
Initial Water Depth |
|
110, 270, and 400mm water depth at start of test (Control – 170mm) |
Other Factors Studied |
|
Number of test cycles needed to achieve equilibration |
|
Variation between results in same soil (compared to average from all holes) |
|
Difference between LTAR based on perc test results vs. soil classification |
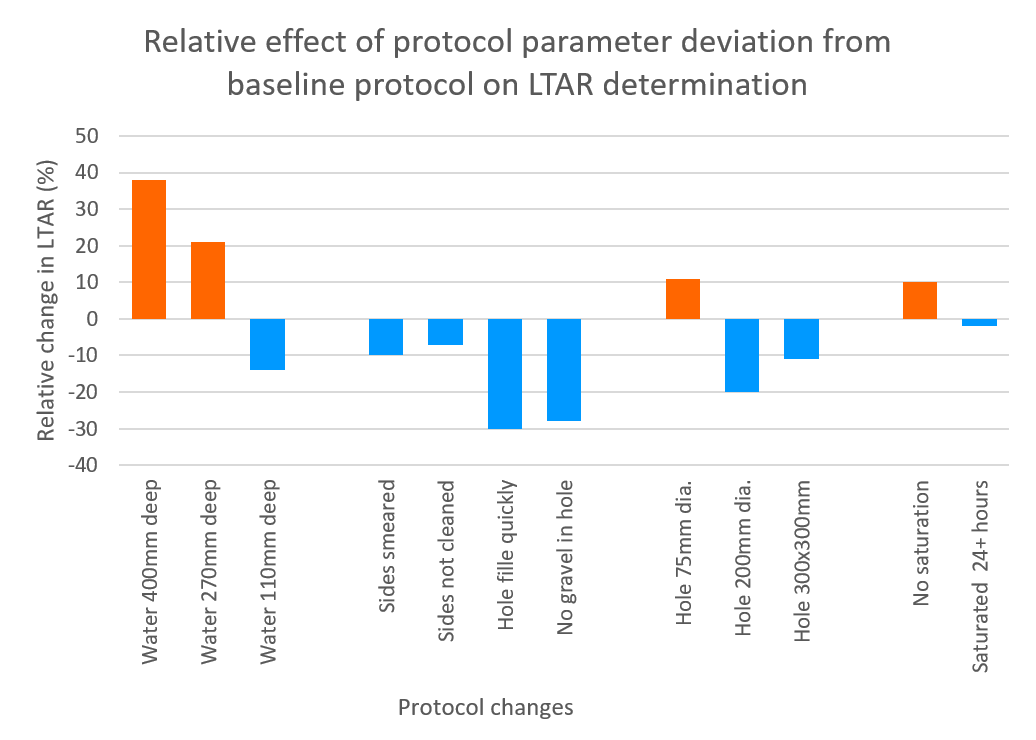
Protocol differences resulted in percolation values that were both higher and lower than that generated using the baseline protocol. Figure 1 shows how much the percolation values varied compared to the baseline protocol, expressed as a percent of the baseline value. Positive values indicate a larger perc value while negative values indicate smaller values. Figure 2 shows the resulting variation in LTAR derived from the 1980 USEPA table. Changes that resulted in an increased perc value resulted in a decreased LTAR value and vice-versa. This makes sense as larger perc test results indicate slower absorption rates.

Conclusion and Recommendations
Our investigation determined that deviating from the baseline protocol results in a significant difference in percolation values and resulting LTAR values. Depending on the deviation, this could result in an under or over-sized absorption system compared to the baseline protocol. Natural variation in soil structure adds additional uncertainly related to the use of perc tests, with percolation values in adjacent holes varying by up to a factor of four, which results in a difference of 30% in the LTAR.
Comparing the LTAR value based on the perc test with the value derived from standard soil classification tests revealed a significant disagreement as well. The average LTAR value based on perc test results was 47 Lpd/m2, while the LTAR value based on the soil classification method was only 18 Lpd/m2. This disagreement may indicate that the soil classification method is not suitable for tropical soils, though further research is needed. Unfortunately, there is no way to know which of these methods is more accurate, since there is no way to know what the true value for LTAR is for any given situation.
EMI was not able to document that the perc test values ever stabilized. Even after performing identical tests 170 times in the same hole, the perc value slowly increased each time the test was repeated, possibly because of slow plugging of the soil surface.
After all this study, what is the best practice EMI Volunteers can reasonably use to size absorption systems? The options for determining the correct LTAR value for EMI projects are limited to perc tests or soil classification. Based on our research, the most useful approach appears to be to perform several perc tests at each location, taking care to carefully follow the baseline protocol, but also perform soil classification to the best of the team’s ability. The resulting LTAR values should be compared and engineering judgement used to select a conservative design rate.
Related articles

Your investment in EMI is a catalyst for change.
Community transformation starts with design. And design needs a strong foundation. Your donation to the EMI Fund supports everything we do.
EMI Tech is looking for contributors – write to editor@emiworld.org with your topic and article outline.